This post may contain affiliate links. If you make a purchase through links on our site, we may earn a commission. Please read our disclosure policy.
If you’ve ever heard “our last frost date is May 10” and then watched a cold snap roll in on May 15, you already know the truth: last frost dates are not guarantees. They’re calculated from historical weather data, and they come with a risk level.
This post will show you:
- Where to look up your last frost and last freeze timing.
- What “50% chance” actually means.
- How to choose a risk level that matches what you’re planting.
If you’re not sure what “gardening zone” you’re in, start here first: What Gardening Zone Am I In?
And if you keep mixing up zones and frost dates, bookmark this too: Hardiness Zone vs Frost Date
Overview
Key Takeaways
- Frost and freeze dates are probabilities, not promises. They’re calculated from historical observations.
- A freeze is 32°F or lower. A hard freeze is 28°F or lower.
- Frost risk increases when temperatures fall below about 36°F, even though frost is not tied to one single temperature.
- “50% last freeze date” is basically a coin flip. Use a lower-risk date (like 10%) for tender plants if you want more confidence.
- Use USDA hardiness zones for perennial winter survival, not for planting dates.
Frost vs Freeze vs Hard Freeze
Gardeners say “last frost” loosely, but the threshold matters.
Freeze (32°F) – A freeze occurs when the air temperature falls below 32°F.
Hard freeze (28°F) – A hard freeze occurs when the air temperature dips below 28°F.
Frost (often around mid-30s, but not one exact number) – Frost depends on temperature and humidity, and it can happen without a freeze and vice versa. Because it’s not tied to one single temperature, many frost probability products use 36°F as a practical threshold for higher frost risk.
Real-world check – Your local National Weather Service often issues a frost advisory when temperatures are expected to fall into the mid-30s°F, and a freeze watch/warning when temperatures are expected to fall below 32°F during the growing season.
What “Last Frost Date” Actually Means
There is no way to forecast the exact last freeze months in advance, so climatologists use past observations to calculate the probability of freezing temperatures after certain dates.
So when you see:
- 90% date – high risk (freezes often occur after this date)
- 50% date – medium risk (basically a coin flip)
- 10% date – lower risk (freezes are less likely after this date)
3 Ways to Find Your Last Frost Date
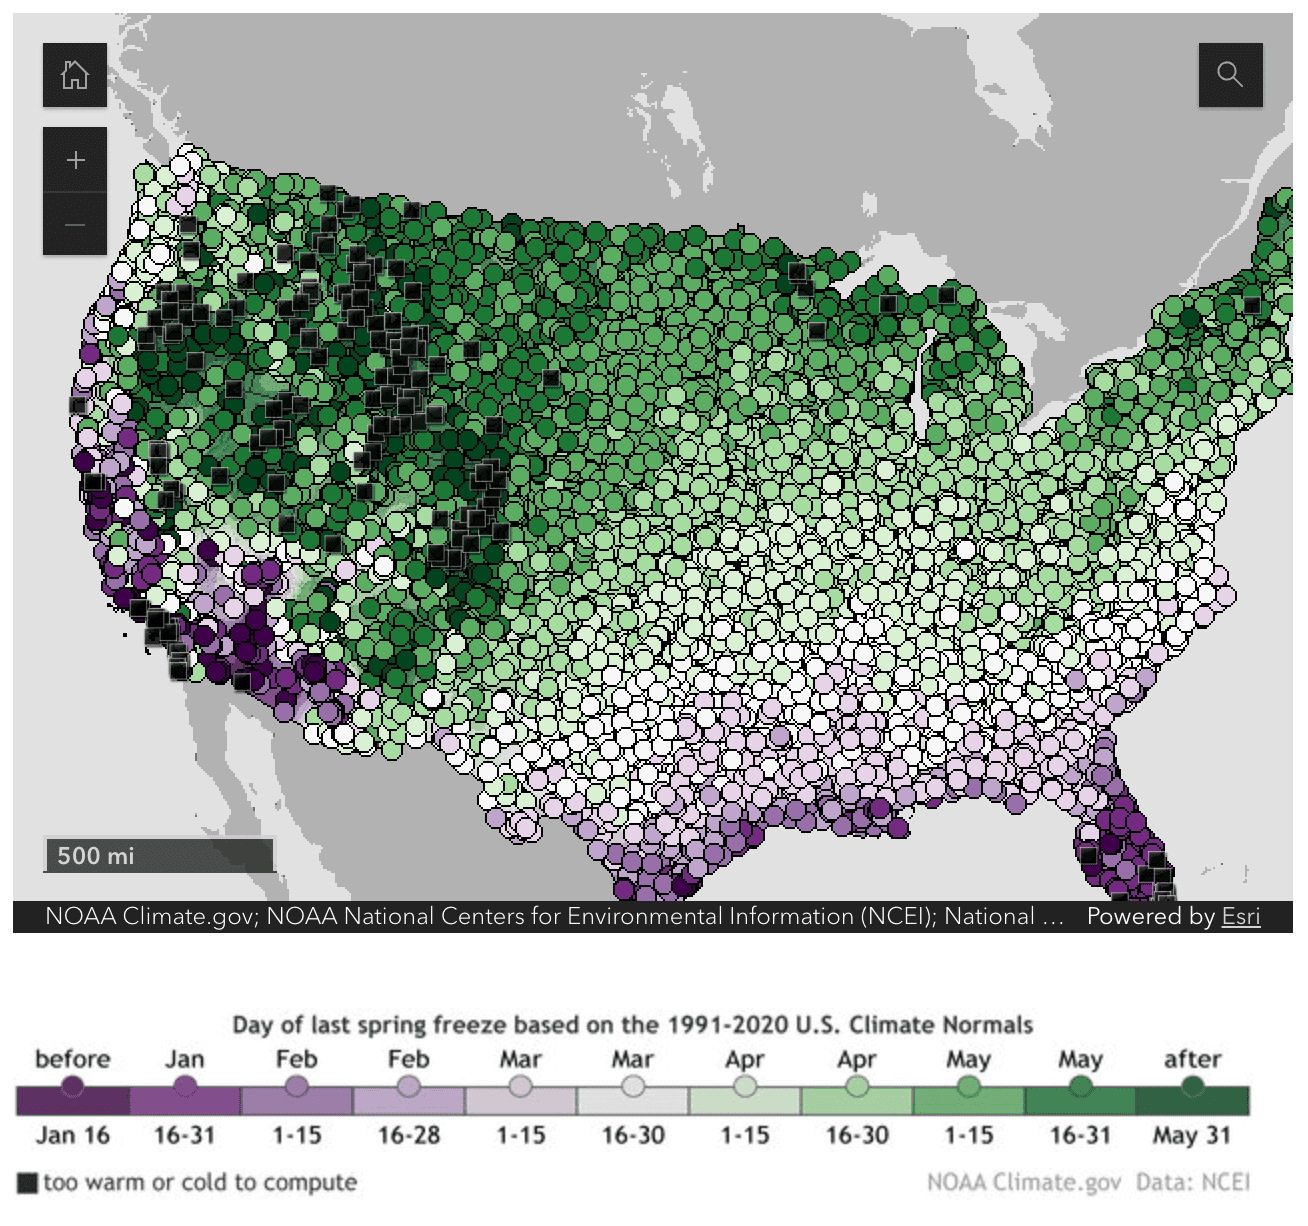
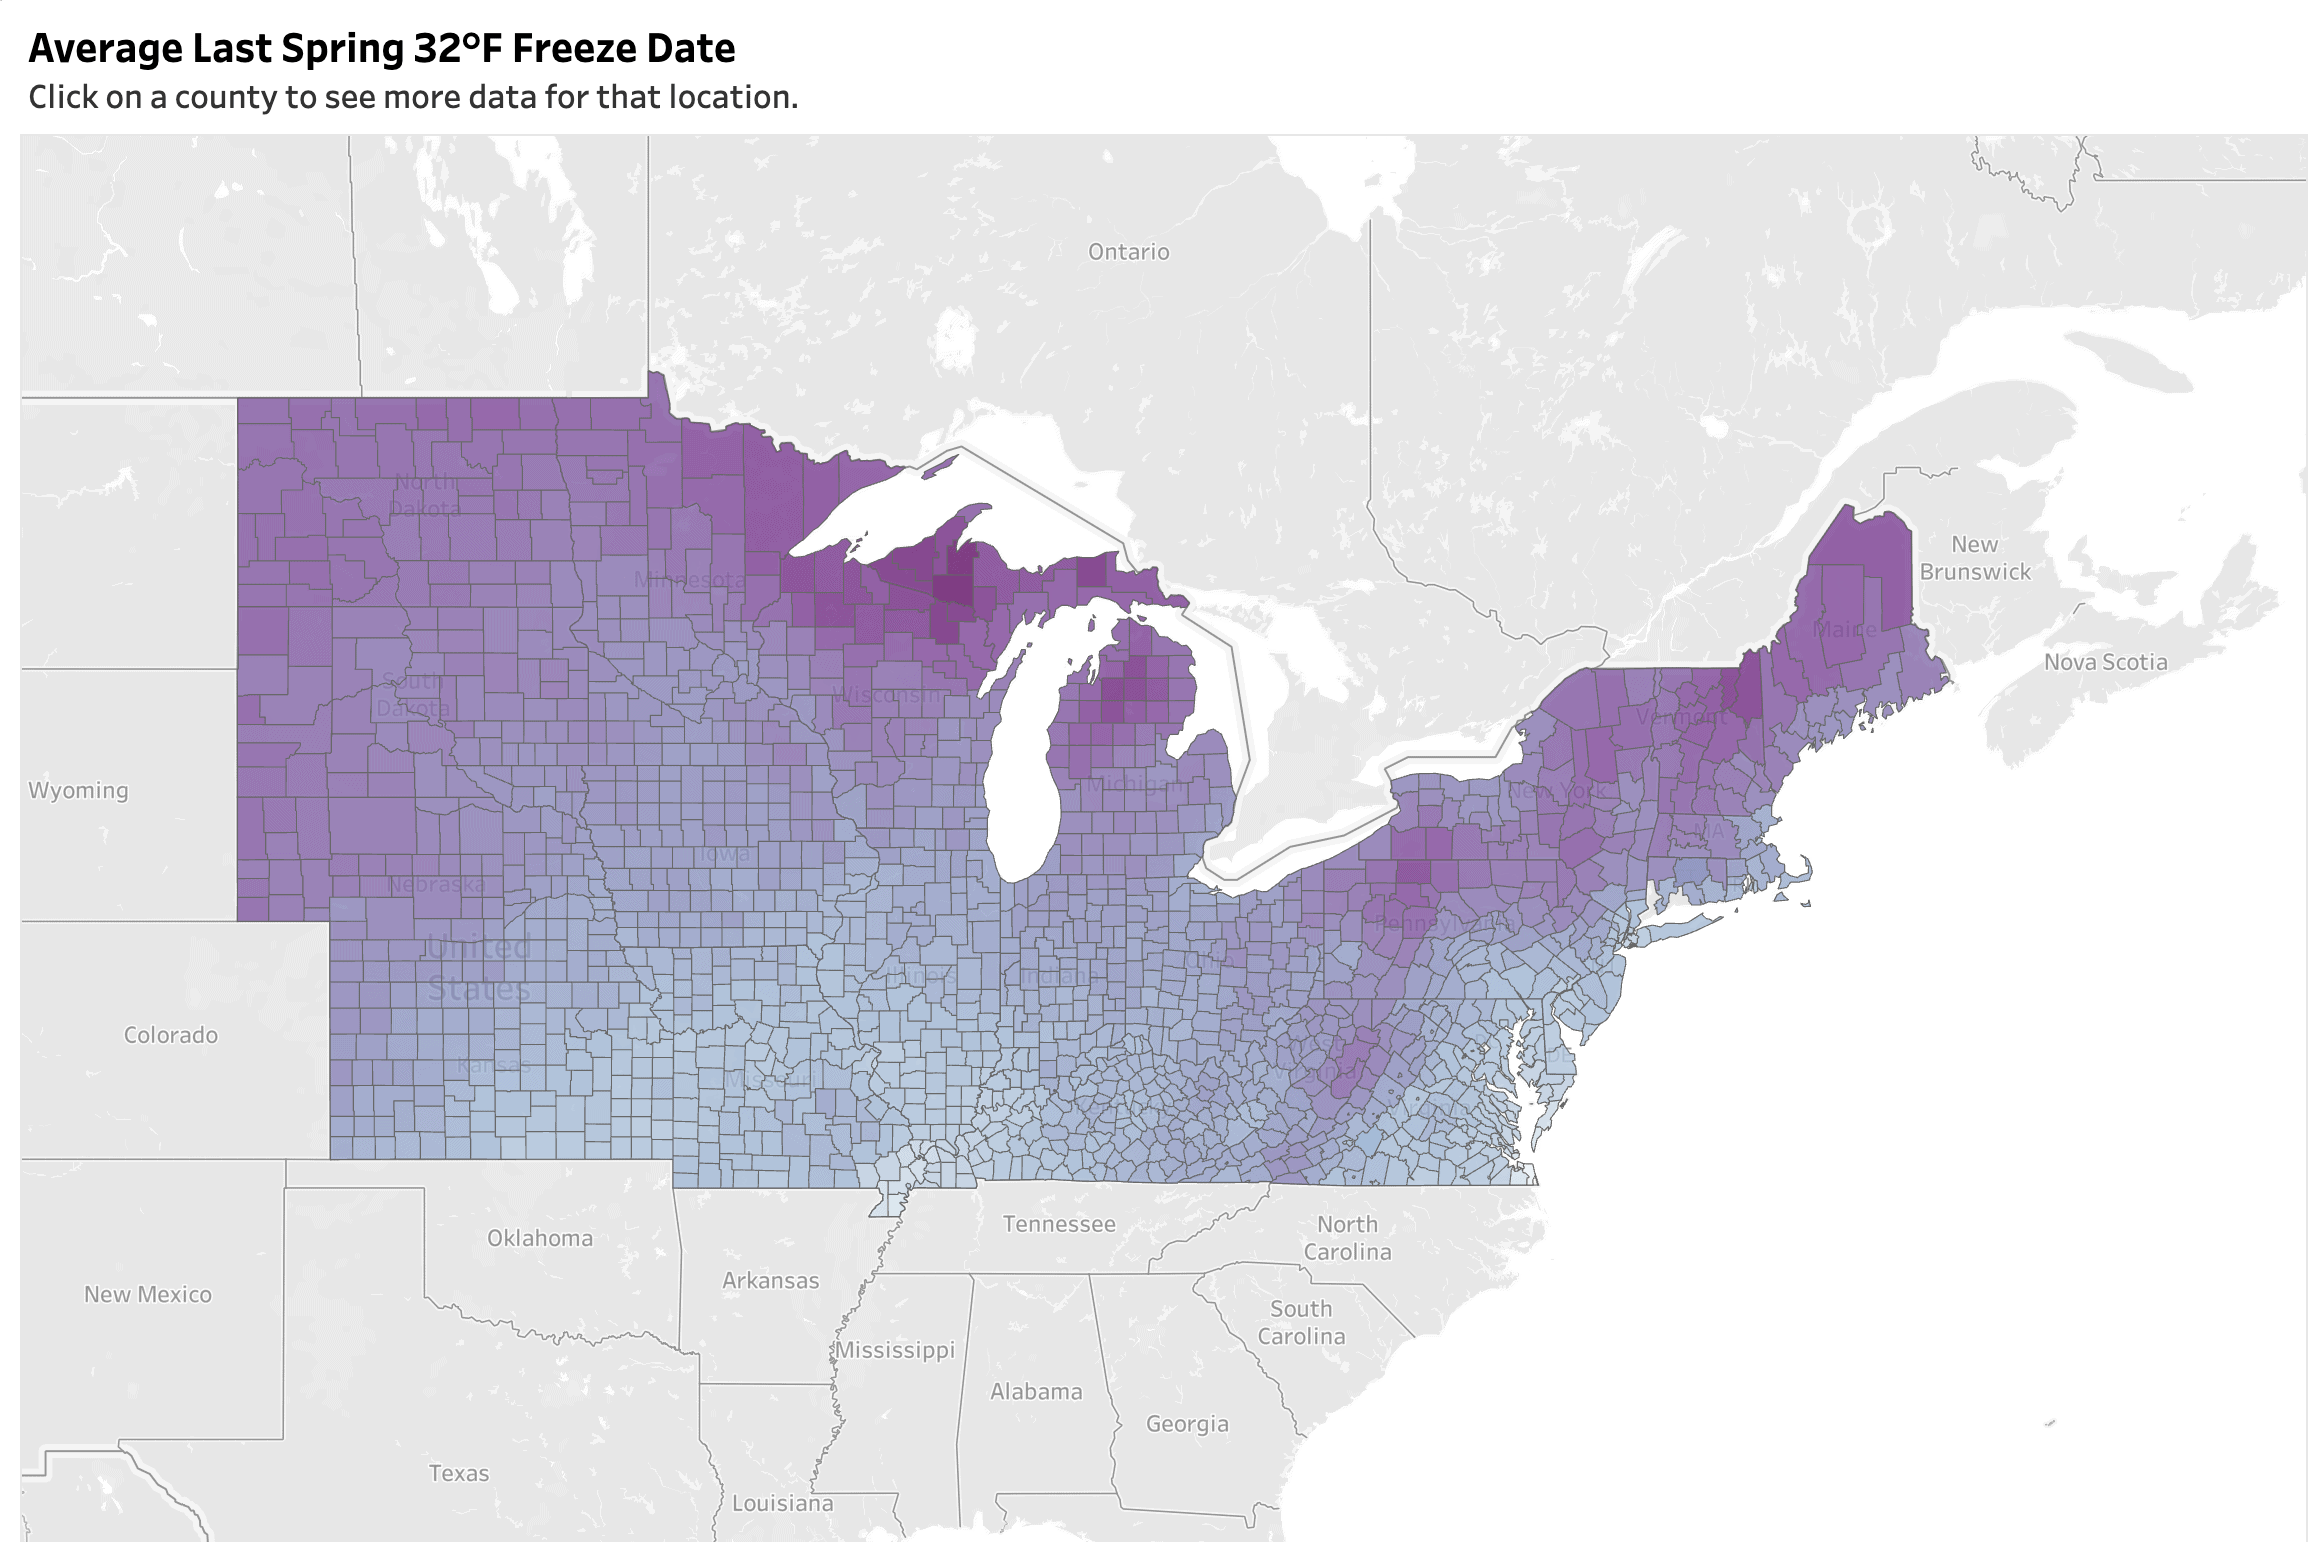
Option 1: Use NOAA’s last spring freeze map
NOAA NCEI publishes an average last date of spring freeze map showing the most common date range you can expect to see 32°F or below for the last time, based on the 1991-2020 U.S. Climate Normals.
For an interactive version with more detail, NOAA Climate.gov provides an interactive map based on NCEI data.
Best for: quick planning and a “ballpark” understanding of your region.
Option 2: Use freeze and frost probability tables
Probability tables let you choose the risk level that matches your style (and what you’re planting). NCEI prepares tables of probable dates for the last frost, freeze, and hard freeze in spring, and the first frost, freeze, and hard freeze in fall.
For an easy calculator, type your zip code in the search box on Almanac.com.
Here’s an example: If a location shows April 5 (4/5) under the 32°F row and the 0.60 probability column, that means there is a 60% chance the temperature will hit 32°F or colder after April 5.
Best for: choosing a “safe” planting date that matches your risk tolerance.
Option 3: Use the MRCC Freeze Date Tool (if located in the Midwest or Northeast)
The Midwestern Regional Climate Center (MRCC), in collaboration with the USDA Midwest Climate Hub, offers a freeze date tool that answers questions such as:
- Average first fall 32°F freeze by county
- What counts as an early or late freeze
- How freeze timing has changed over time
MRCC also defines the risk-style percentiles clearly:
- Early = 10th percentile (only 10% of freeze dates were earlier)
- Late = 90th percentile (only 10% of freeze dates were later)
Best for: Those in the Midwest and Northeast who want county-level clarity and risk-based dates.
How to Choose the Right Probability for Planting
Here’s a simple way to match the risk level to what you’re planting:
For tender plants (tomatoes, peppers, basil, zinnias) – Use a lower-risk date (often the 10% date for 32°F freeze risk) if you want to avoid heartbreak. The whole point of probabilities is choosing dates based on how much risk you’re willing to accept.
For cool-season plants (greens, peas, brassicas) – You can plant earlier because many cool-season crops tolerate light frosts. Even then, it helps to know what kind of cold event you’re watching for (frost vs freeze vs hard freeze).
For “I like to push it” gardeners – Use the 50% date as your planning marker, but understand what you’re signing up for: it literally means freezes still happen after that date in about half of the years.
Frequently Asked Questions
Not always. Many resources track frost risk around 36°F, freeze at 32°F, and hard freeze at 28°F. Make sure you know which threshold your source is using.
Because it’s based on weather patterns, and weather varies. These dates are based on historical observations and probabilities, not long-range certainty.
Conclusion
When you understand probabilities, you can treat the last frost date as a planning tool. Pick your risk level, stick with it, and you’ll make better decisions year after year, even when spring is unpredictable.
Next step: Put those dates to work with a simple seasonal checklist. If you garden in Zone 5b like me, make sure to check out my month-by-month planting calendar. It pairs perfectly with this guide because it turns your frost timing into an actual month-by-month plan.